Image Details
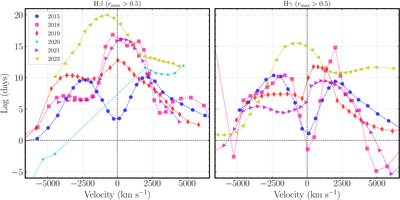
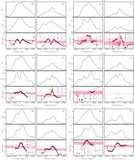
Caption: Figure 5.
The temporal variations of Hβ and Hγ VRLPs are systematically compared across six observing seasons (2015, 2018, 2019, 2020, 2021, and 2023) using 30 equal-flux velocity bins, with lags below a maximum correlation coefficient of 0.5 excluded. Vertical and horizontal dotted lines indicate the line core at zero velocity and zero time lag, respectively.
Other Images in This Article
Copyright and Terms & Conditions
© 2025. The Author(s). Published by the American Astronomical Society.
Copyright ©
2025 Astronomy Image Explorer. All Rights Reserved.