Image Details
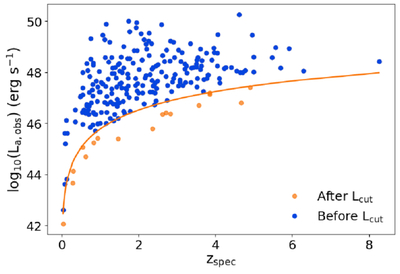
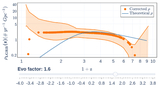
Caption: Figure 1.
La,obs − z distribution of 242 LGRBs with X-ray plateaus. The orange solid line shows the luminosity threshold corresponding to a flux limit of 1.15 × 10⁻¹² erg cm−2 s−1. Orange points highlight the 17 LGRBs cut due to this luminosity threshold, and blue points correspond to LGRBs that are included further in the analysis.
Other Images in This Article
Copyright and Terms & Conditions
© 2025. The Author(s). Published by the American Astronomical Society.
Copyright ©
2026 Astronomy Image Explorer. All Rights Reserved.