Image Details
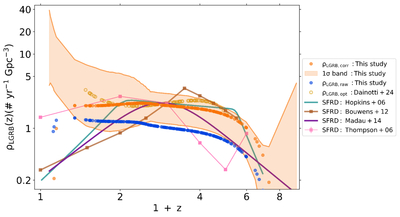
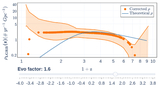
Caption: Figure 4.
LGRB-RD (ρ [yr−1 Gpc−3]) − (1 + z) distribution for raw (solid blue points) and corrected (solid orange points) computed from our X-ray plateau sample. The orange-colored band represents the 1σ error band for the ρLGRB,corr points. Corrected LGRB-RD for the optical plateau sample from M. G. Dainotti et al. (2024) is denoted with yellow open circles. Various SFRD models from the literature are also included in this plot for comparison.
Other Images in This Article
Copyright and Terms & Conditions
© 2025. The Author(s). Published by the American Astronomical Society.
Copyright ©
2026 Astronomy Image Explorer. All Rights Reserved.