Image Details

Caption: Figure 3.
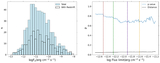
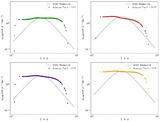
Left panels: cumulative LGRB density distribution for the raw (blue) and corrected (orange) cases. The black solid line corresponds to the piecewise functional fit used to calculate the LGRB-RD later. Right panels: log–log distribution of Φ(L) and L (erg s−1). The blue and orange open stars show the raw and corrected Φ ( > L) points, respectively. The black dashed lines correspond to the best-fit functions described in Equation (11). Residuals for raw and corrected σ (z), and raw and corrected Φ (>L) cases are shown in the bottom panel.
Other Images in This Article
Copyright and Terms & Conditions
© 2025. The Author(s). Published by the American Astronomical Society.
Copyright ©
2026 Astronomy Image Explorer. All Rights Reserved.