Image Details
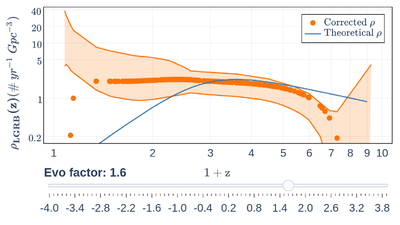
Caption: Figure 5.
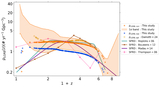
Example figure of ρLGRB(z) in 1 + z space. The orange-filled circles and the corresponding orange band represent the ρcorr computed from Equation (13) and its 1σ band. The blue solid curve is ρtheor derived from Equation (14) and multiplied with (1 + z)δ. This example figure is one case of the interactive figure with δ = 1.6. The interactive figure has a slider for the evolution factor (δ) at the bottom of the figure. The slider will help in visualizing the variation in ρtheor for a changing δ value.
An interactive version of this figure is available in the online article.
An interactive version of this figure is available.
An interactive version of this figure is available in the online journal.
Other Images in This Article
Copyright and Terms & Conditions
© 2025. The Author(s). Published by the American Astronomical Society.