Image Details
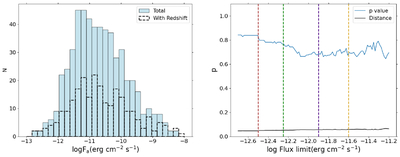
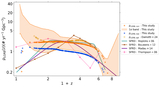
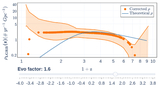
Caption: Figure 6.
Left panel: ﹩\mathrm{log}\,{F}_{{\rm{a}}}\,(\mathrm{erg}\,{\mathrm{cm}}^{-2}\,{{\rm{s}}}^{-1})﹩ histogram for LGRBs with X-ray plateaus. The blue histogram bars correspond to LGRBs with and without redshift measurements. The black dashed histogram bars are for LGRBs with redshift measurements only. Right panel: p-value (blue line) and distance between the two histograms’ cumulative distributions (black line) for varying flux limit cuts. The red, green, purple, and yellow dashed lines show the different ﹩{F}_{\mathrm{lim}}=-12.5,-12.25,-11.9﹩, and −11.6, respectively. The chosen ﹩{F}_{\mathrm{lim}}﹩ value of −11.9 is the purple dashed line.
Other Images in This Article
Copyright and Terms & Conditions
© 2025. The Author(s). Published by the American Astronomical Society.