

Image Details
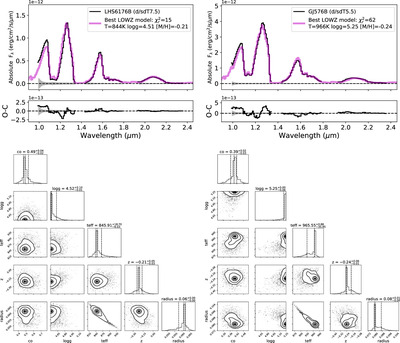
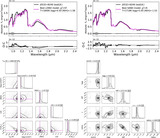
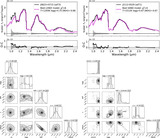
Caption: Figure 6.
Best-fit LOWZ models and model parameter distributions for Keck/NIRES data for the metallicity benchmarks LHS 6176B (left) and GJ 576B (right). The top panels compare the observed spectra in absolute flux density (black lines) to the best-fit model (magenta line). The bottom panels show parameter distributions for Teff, ﹩\mathrm{log}g﹩, [M/H], C/O, and radius. Plots along the diagonal axis show the marginalized posterior distributions for each parameter, with 16%, 50%, and 84% quantiles indicated as vertical dashed lines (see Table 7). The remaining contour plots display 2D distributions of parameter pairs in the posterior solutions, highlighting parameter correlations. Note that parameter distributions are weighted by their χ2 value following Equation 10.
Other Images in This Article
Show More
Copyright and Terms & Conditions
© 2025. The Author(s). Published by the American Astronomical Society.

