

Image Details
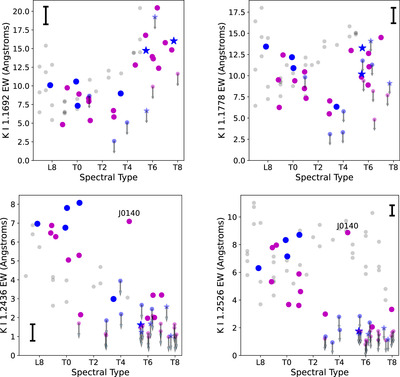
Caption: Figure 5.
Equivalent width measurements of the 1.1692 μm (top left), 1.1178 μm (top right), 1.2436 μm (bottom left), and 1.2526 μm (bottom right) K I lines based on medium-resolution data in our spectral sample. Subdwarf candidates are indicated by magenta circles, metal-poor comparison sources by blue circles, and benchmark companions by blue stars. Smaller symbols with downward arrows indicate 3σ upper limits. A comparison sample of measurements for local L and T dwarfs with significant detections reported in E. C. Martin et al. (2017) are indicated as gray circles. The typical measurement uncertainties for sources with significant detections are indicated by the black error bar in the corners of each panel. Each source is given a small random offset in spectral type to help differentiate overlapping data points. The unusually red high-velocity T dwarf J0140+0150 is specifically labeled in the bottom two panels.
Other Images in This Article
Show More
Copyright and Terms & Conditions
© 2025. The Author(s). Published by the American Astronomical Society.

