

Image Details
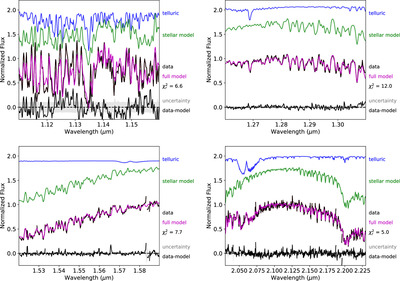
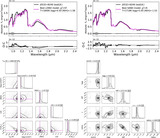
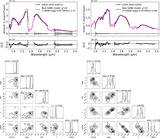
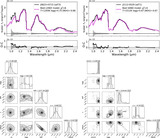
Caption: Figure 10.
Forward model fits to Y− (top left), J− (top right), H− (bottom left), and K−band (bottom right) spectra of GJ 576B. Each panel displays from top to bottom: the best-fit telluric model (blue), the best-fit stellar model (green), the observed data (black) compared to the full data model (magenta), and the difference of these (black) compared to the data uncertainty (gray band, ±1σ). The reduced ﹩{\chi }_{r}^{2}﹩ (Equation (9)) is listed along the right axis.
Other Images in This Article
Show More
Copyright and Terms & Conditions
© 2025. The Author(s). Published by the American Astronomical Society.

Copyright ©
2026 Astronomy Image Explorer. All Rights Reserved.
