

Image Details
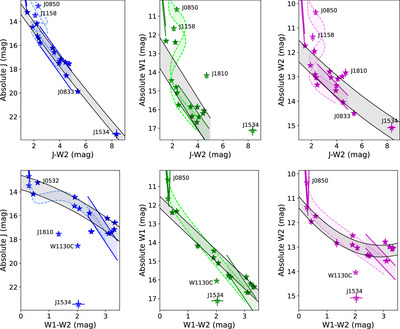
Caption: Figure 2.
Absolute magnitudes in J (left, in blue), W1 (middle, in green), and W2 (right, in magenta) bands as a function of J − W2 (top) and W1 − W2 (bottom) colors. Symbols display measurements for metal-poor late-L and -T dwarfs with parallax measurements (Table 1) compared to empirical relations for dwarfs (light colored shaded regions with dashed lines: T. J. Dupuy & M. C. Liu 2012) and subdwarfs (dark colored shaded regions with solid lines; E. C. Gonzales et al. 2018; Z. H. Zhang et al. 2019b). Some individual sources are labeled. Gray shaded regions delineate our empirical relationships computed over the ranges 1 mag ≤J − W2 ≤ 8.5 mag and 0 mag ≤W1 − W2 ≤ 3.5 mag. Sources not included in each color–magnitude fit are indicated by open symbols.
Other Images in This Article
Show More
Copyright and Terms & Conditions
© 2025. The Author(s). Published by the American Astronomical Society.

