Image Details
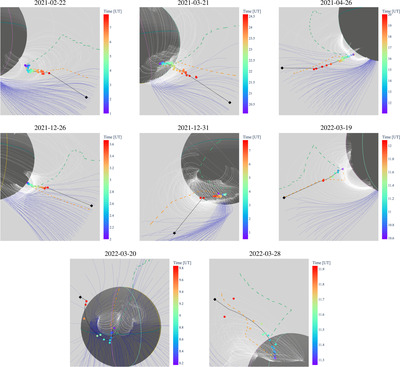
Caption: Figure 7.
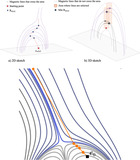
Projections of the “eruptive” (black solid line), “topological” (orange dashed line), and “gradient” (green dashed line) paths for the studied events. The colored dots are the same as in Figure 3. The white lines correspond to closed field lines and the blue lines correspond to open field lines. Over the sphere of 1 R☉, we plot the equator (teal line), the STA meridian (pink line), the SolO meridian (gold line), and the SDO meridian (light green line) for reader reference.
Other Images in This Article
Copyright and Terms & Conditions
© 2024. The Author(s). Published by the American Astronomical Society.
Copyright ©
2026 Astronomy Image Explorer. All Rights Reserved.