Image Details
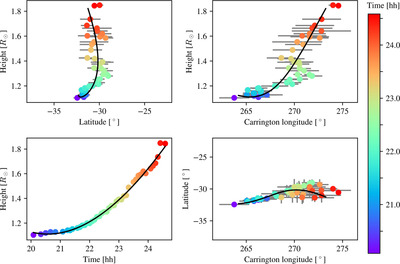
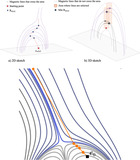
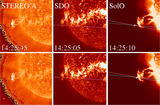
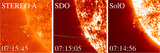
Caption: Figure 2.
Triangulated and fitted coordinates for the 2021 March 21 filament eruption. The colored dots are the same as in Figure 1. The gray bars indicate the standard deviation at each time (for the radial direction, they are smaller than the size of the dots). The black lines are the fitted coordinates converted from the Cartesian splines.
Other Images in This Article
Copyright and Terms & Conditions
© 2024. The Author(s). Published by the American Astronomical Society.
Copyright ©
2026 Astronomy Image Explorer. All Rights Reserved.