Image Details
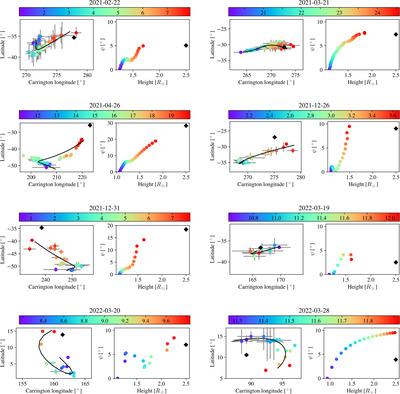
Caption: Figure 3.
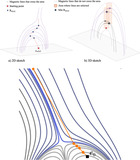
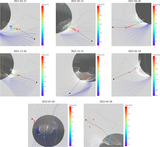
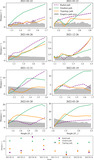
Projected deflection for all events. For each event, the left subpanel shows the triangulated (colored dots scaled by time (UT)) and fitted curve (black line) for the latitude and Carrington longitude. The black diamond shows the interpolated CME position at 2.5 R☉. The right subpanel of each date shows the 3D angle of deflection ψ in function of height.
Other Images in This Article
Copyright and Terms & Conditions
© 2024. The Author(s). Published by the American Astronomical Society.
Copyright ©
2026 Astronomy Image Explorer. All Rights Reserved.