Image Details
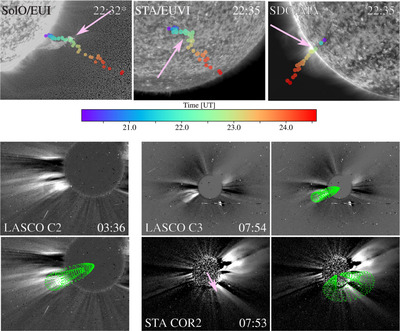
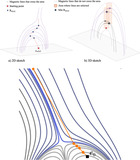
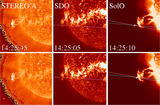
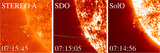
Caption: Figure 1.
Upper panels: triangulated coordinates for the 2021 March 21 filament eruption. The colored dots represent the mean measure of the coordinates for each time, as indicated by the color bar. Each panel shows the filament as observed by SolO, STA, and SDO at 22:35 (22:32 for SolO is the time at 1 au). The pink arrows indicate the filament apex at the time of the observation. Lower panels: nonradial GCS applied to the 2021 March 21 CME, observed on 2021 March 22 from STA and LASCO. The left panels show the CME early observation from the single viewpoint of LASCO C2 and the GCS mesh. The middle panels show the CME observed simultaneously from LASCO C3 and STA COR2 at 7:54 UT, and the corresponding GCS mesh (right panels).
Other Images in This Article
Copyright and Terms & Conditions
© 2024. The Author(s). Published by the American Astronomical Society.