Image Details
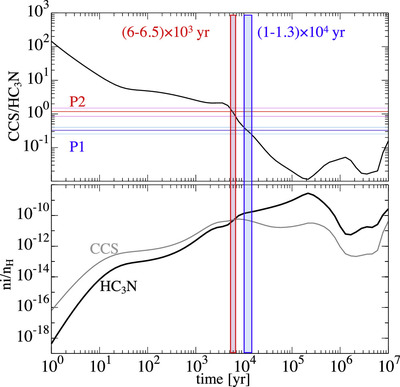
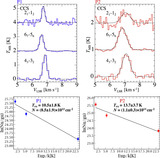
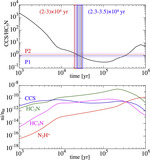
Caption: Figure 6.
The upper panel shows comparisons of the observed CCS/HC3N abundance ratios at P1 and P2 to the modeled results. The horizontal lines show the observed values (light-colored lines indicate the upper and lower limits). The lower panel shows abundances of HC3N (black) and CCS (gray). The shaded vertical regions indicate the best-fit ages.
Other Images in This Article
Copyright and Terms & Conditions
© 2024. The Author(s). Published by the American Astronomical Society.
Copyright ©
2026 Astronomy Image Explorer. All Rights Reserved.