Image Details
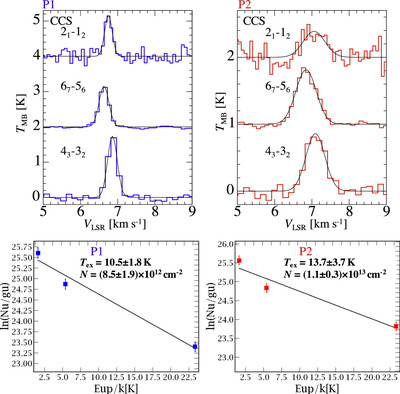
Caption: Figure 4.
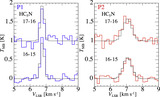
Upper panels show CCS spectra of the three transitions at P1 (left) and P2 (right). Blue and red lines indicate the observed spectra, and black curves indicate the results of the Gaussian fitting. Lower panels show rotational diagrams of the CCS lines at P1 (left) and P2 (right). Errors are calculated from the Gaussian fitting errors and the calibration errors (10%).
Other Images in This Article
Copyright and Terms & Conditions
© 2024. The Author(s). Published by the American Astronomical Society.
Copyright ©
2026 Astronomy Image Explorer. All Rights Reserved.