Image Details
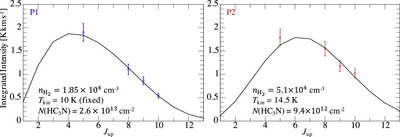
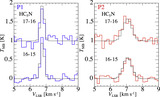
Caption: Figure 3.
Results of the SLED analysis with HC3N lines toward P1 (left) and P2 (right). The blue and red points indicate the observed values. The 10% errors due to the typical uncertainty of the chopper-wheel method are taken into consideration. The black curves indicate the best-fitting result with the parameters shown in each panel: ﹩{n}_{{{\rm{H}}}_{2}}=1.85\times {10}^{4}﹩ cm−3, T kin = 10 K (fixed), and N(HC3N)=2.6 × 1013 cm−2 for P1, and ﹩{n}_{{{\rm{H}}}_{2}}=5.1\times {10}^{4}﹩ cm−3, T kin = 14.5 K, and N(HC3N) = 9.4 × 1012 cm−2 for P2.
Other Images in This Article
Copyright and Terms & Conditions
© 2024. The Author(s). Published by the American Astronomical Society.
Copyright ©
2026 Astronomy Image Explorer. All Rights Reserved.