Image Details
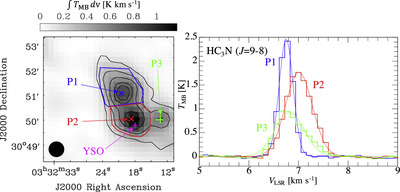
Caption: Figure 2.
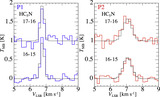
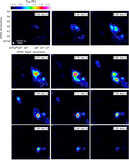
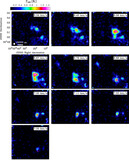
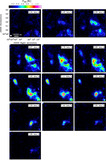
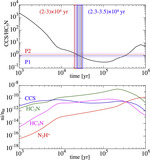
The left panel shows a regridded integrated-intensity map of HC3N (J = 9−8) overlaid with contours indicating the HC3N (J = 5−4) line (contour levels are 20%, 40%, 60%, 80%, 90% of the peak intensity). Two crosses (P1 and P2) indicate two positions where we conducted spectral analyses. The polygons harboring P1 and P2 indicate the regions where we derived the mass. The green cross indicated as P3 is the other emission peak. The magenta cross indicates the position of the YSO. The right panel shows spectra of the HC3N (J = 9−8) line at P1 (blue), P2 (red), and P3 (green). The curves show fitting results with the Gaussian profile. The fitting parameters are summarized in Table 5 in Appendix B.
Other Images in This Article
Copyright and Terms & Conditions
© 2024. The Author(s). Published by the American Astronomical Society.