Image Details
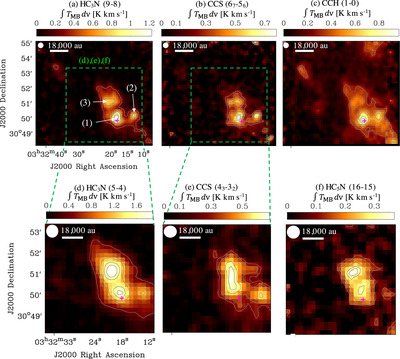
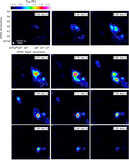
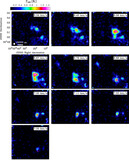
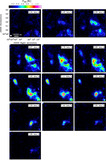
Caption: Figure 1.
Integrated-intensity maps of (a) HC3N (9−8), (b) CCS (67−56), (c) CCH (N = 1−0, ﹩J=\tfrac{3}{2}\text{-}\tfrac{1}{2}﹩, F = 2−1), (d) HC3N (5−4), (e) CCS (43−32), and (f) HC5N (16−15). Contour levels are values relative to their peak levels; (a, d) 20%, 40%, 50%, 60%, 80%, 90%; (b, c, f) 30%, 40%, 50%, 60%, 80%, 90%; (e) 40%, 50%, 60%, 80%, 90%. The peak levels are (a) 1.27 K km s−1, (b) 0.78 K km s−1, (c) 0.97 K km s−1, (d) 1.90 K km s−1, (e) 0.68 K km s−1, and (f) 0.37 K km s−1. The integrated velocity ranges are (a) 6.1–8.2 km s−1, (b) 5.9–7.6 km s−1, (c) 5.6–8.4 km s−1, (d) 5.8–8.4 km s−1, (e) 6.1–8.1 km s−1, and (f) 6.1–7.6 km s−1 for each line. The noise levels of these maps are (a) 0.03 K km s−1, (b) 0.047 K km s−1, (c) 0.04 K km s−1, (d) 0.03 K km s−1, (e) 0.025 K km s−1, and (f) 0.05 K km s−1. The green dashed squares in panels (a) and (b) indicate the map regions of panels (d)–(f). Three identified structures are labeled as (1)–(3) in panel (a). The white filled circles in the top left corner indicate the beam sizes (18″ and 37″ at 3 mm and 7 mm, respectively). The magenta cross indicates the position of the YSO.
Other Images in This Article
Copyright and Terms & Conditions
© 2024. The Author(s). Published by the American Astronomical Society.