Image Details
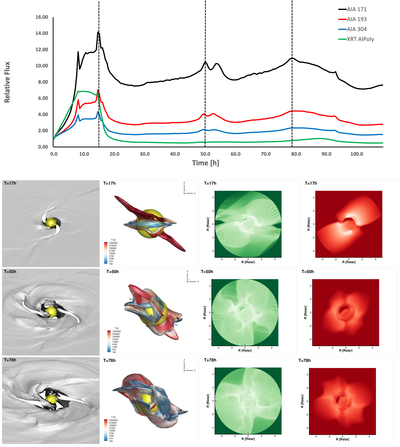
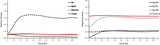
Caption: Figure 5.
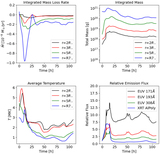
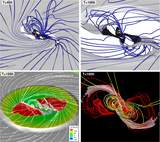
Top panel: integrated fluxes of the synthetic EUV/X-ray images produced by the simulation as a function of time. The fluxes are normalized to their individual initial fluxes at t = 0 hr. Dashed lines mark the temporal peak increase in the fluxes at t = 17, 50, and 78 hr. The bottom three panels show the synthetic 171 Å EUV and XRT images (two left columns, respectively) during the time of the peak flux increase. The left panel shows an isosurface similar to that in Figure 2. The second column shows an isosurface of v r = −30 km s−1, which represents an infalling material region, colored with contours of the temperature. It shows some, but very little cold material accreting. The left two columns show the three-dimensional structure close to the star during the time of the EUV/X-ray flux increase and from the same viewing angle as the LOS of the images in the two right columns.
Other Images in This Article
Copyright and Terms & Conditions
© 2023. The Author(s). Published by the American Astronomical Society.