Image Details
Caption: Figure 4.
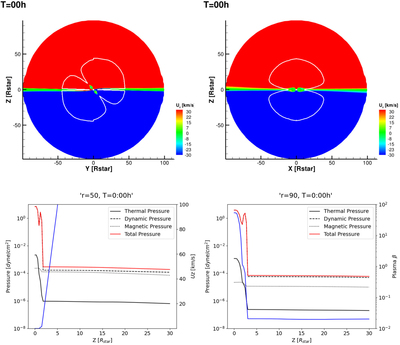
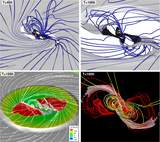
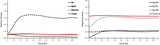
First and second columns: x = 0 and y = 0 meridional cuts colored with the vertical (u x ) component of the velocity. The solid white line represents the location where the Alfvénic Mach number equals one. Third and fourth columns: vertical structure of the simulation pressure as a function of height above the equatorial plane. The vertical lines are extracted at r = 50R ⋆ (third panel) and r = 90R ⋆ (right panel). The pressure components are thermal, dynamic, magnetic, and total. Also shown are the values of the vertical component of the velocity (third panel) and the plasma β (fourth panel). This is a sample snapshot at t = 0. The animation of this figure shows the sequence from t = 0 to t = 108:30 hr in 30 minute steps. The real-time duration of the animation is 37 s and it covers the full 108.5 hr of the simulation.
(An animation of this figure is available.)
The video/animation of this figure is available in the online journal.
Other Images in This Article
Copyright and Terms & Conditions
© 2023. The Author(s). Published by the American Astronomical Society.