Image Details
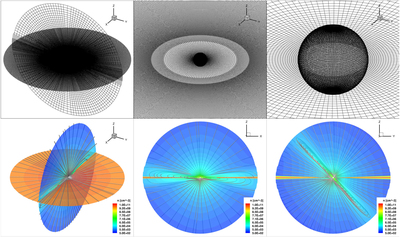
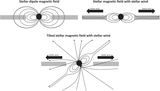
Caption: Figure 1.
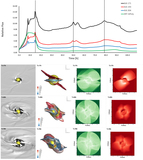
Top: the grid structure in the simulation displayed on a sphere of r = 1.1R ⋆, and on the z = 0, and x = 0 (top left only) slices. The full domain is shown on the top left panel, while the top middle and top right panels show a zoom-in view at different levels, respectively. Bottom: the initial condition of the simulation. The bottom left panel shows a three-dimensional view of the z = 0 and y = 0 slices colored with number density contours, and selected magnetic field lines are shown in gray. The bottom middle and bottom right panels show a similar display of the y = 0 and x = 0 slices, respectively.
Other Images in This Article
Copyright and Terms & Conditions
© 2023. The Author(s). Published by the American Astronomical Society.