Image Details
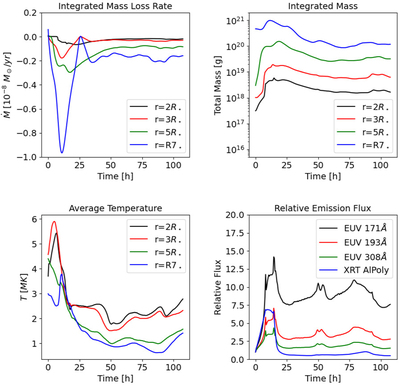
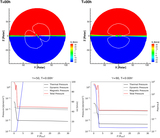
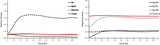
Caption: Figure 6.
Integrated values on four spheres at r = 2 (black), 3 (red), 5 (green), and 7 (blue) R ⋆ as a function of time. The plots are for the mass-loss rate (top left), integrated mass (top right), temperature (bottom left), and integrated synthetic emission flux (bottom right).
Other Images in This Article
Copyright and Terms & Conditions
© 2023. The Author(s). Published by the American Astronomical Society.
Copyright ©
2026 Astronomy Image Explorer. All Rights Reserved.