Image Details
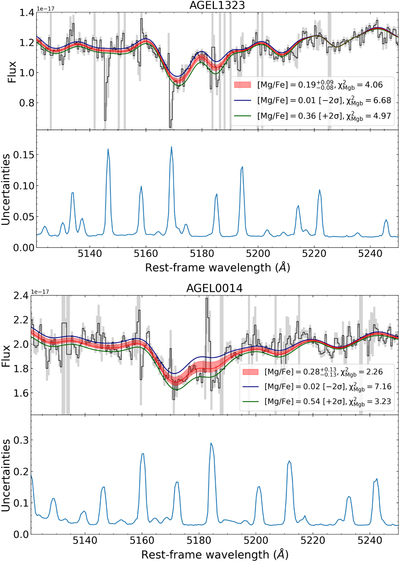
Caption: Figure 9.
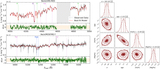
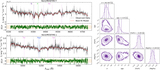
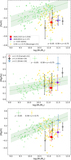
Model spectra with different [Mg/Fe] vs. observed spectra for AGEL1323 (top) and AGEL0014 (bottom) near the Mg b triplet at ∼5170 Å. In each plot, the upper panel shows the models corresponding to a 68% confidence interval of the best-fit [Mg/Fe] by the red region. The model spectra at 2σ deviation from the median of [Mg/Fe] are overplotted by the blue and green lines for comparison. The masked pixels are marked by the gray vertical regions. The 1σ random errors of the observed spectra are indicated by the gray shaded regions. The lower panel of each plot is the error spectrum, representing the sky background. The models with higher or lower [Mg/Fe] give poorer fits to the Mg b triplet, which validates our measured [Mg/Fe] from alf.
Other Images in This Article
Copyright and Terms & Conditions
© 2023. The Author(s). Published by the American Astronomical Society.