Image Details

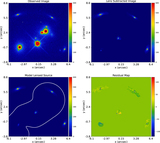
Caption: Figure 4.
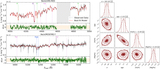
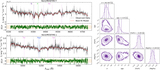
Observed MOSFIRE-K s image (upper left), observed image with a model for the foreground lensing galaxy subtracted (upper right), best-fit model lensed source (bottom left), and residual map (bottom right) of lens modeling performed with PyAutoLens. The units of the color bar are counts. Cutouts were extracted from the full MOSFIRE-K s image shown in Figure 1. The white line plotted over the bottom left panel is the lens model’s tangential critical curve. In the lens-subtracted image, a faint counter-image is seen around (x = 0.″7, y = − 0.″7), which is successfully recovered in the model lensed source.
Other Images in This Article
Copyright and Terms & Conditions
© 2023. The Author(s). Published by the American Astronomical Society.