Image Details
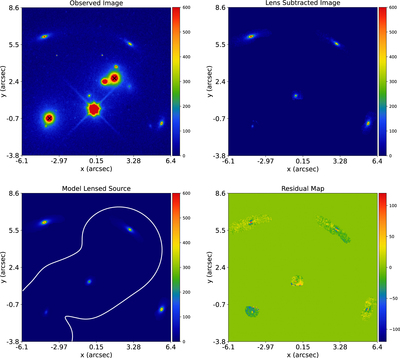
Caption: Figure 3.
Observed HST F200 image (upper left), observed image with a model for the foreground lensing galaxies subtracted (upper right), best-fit model lensed source (bottom left), and residual map (bottom right) of lens modeling performed with PyAutoLens. Cutouts were extracted from the full HST F200 image shown in Figure 2. The white line plotted over the bottom left panel is the lens model’s tangential critical curve. In the lens-subtracted image, five distinct multiple images are seen, which are all reproduced by the lens model. The units of the color bar are counts.
Other Images in This Article
Copyright and Terms & Conditions
© 2023. The Author(s). Published by the American Astronomical Society.
Copyright ©
2025 Astronomy Image Explorer. All Rights Reserved.