Image Details
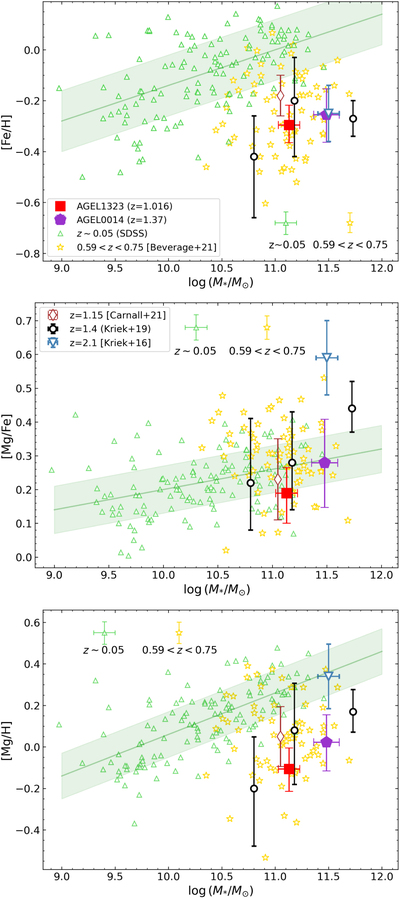
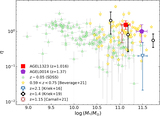
Caption: Figure 8.
[Fe/H] (top), [Mg/Fe] (middle), and [Mg/H] (bottom) as a function of the stellar mass for quiescent galaxies. AGEL1323 at z = 1.016 and AGEL0014 at z = 1.37 are plotted as a filled square and a pentagon, respectively. The SDSS galaxies at z ∼ 0.05 (open green triangles) are taken from Leethochawalit et al. (2019) but remeasured with alf for consistency. The open yellow stars show the measurements for the LEGA-C sample at 0.59 < z < 0.75 by Beverage et al. (2021). The abundances of individual high-z quiescent galaxies measured by Kriek et al. (2016; blue open down triangle) and Kriek et al. (2019; black open circles) as well as that of a stacked spectrum at z = 1.15 determined by Carnall et al. (2022) are plotted for comparison. The green solid lines and shaded regions represent the best-fit linear relations and intrinsic scatter of the z ∼ 0.05 SDSS galaxies.
Other Images in This Article
Copyright and Terms & Conditions
© 2023. The Author(s). Published by the American Astronomical Society.