Image Details
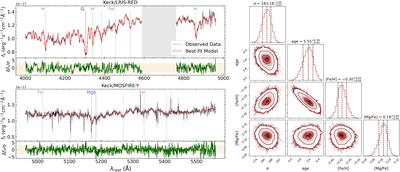
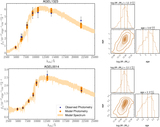
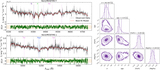
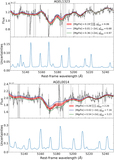
Caption: Figure 6.
Left: observed spectrum (black) and best-fit SSP model (red) used in this work for AGEL1323. The gray areas represent the 1σ uncertainties of the observed spectrum. We masked out a small portion in the LRIS-red spectrum for AGEL1323 because of the telluric features that cannot be corrected. The green lines show the ratio of the model residuals over the uncertainties, with the 3σ regions indicated by the shaded beige regions. Right: corner plot showing the posterior distributions and covariances among velocity dispersion (σ), age, [Fe/H], and [Mg/Fe] of the best-fit model. The uncertainties shown here are the random errors obtained from the posterior distribution, without being corrected for the systematic errors (see Section 3.3). The contours demonstrate the 1σ, 2σ, and 3σ levels.
Other Images in This Article
Copyright and Terms & Conditions
© 2023. The Author(s). Published by the American Astronomical Society.