Image Details
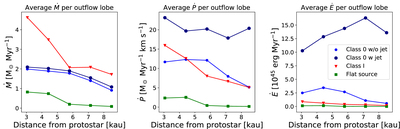
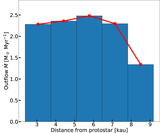
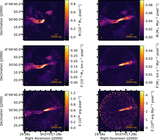
Caption: Figure 9.
Profiles of the average molecular outflow mass, momentum, and energy rates per outflow lobe for different protostellar evolutionary classes (Class 0, Class I, and flat spectrum). For the Class 0 sources, we show the average rates with and without inclusion of the high-velocity jet component. All results shown are inclination corrected. In creating these plots, the Class 0 source HOPS 408 was not included because its outflow is barely resolved, and the flat-spectrum sources HOPS 166 and HOPS 194 were not included because they have significantly higher bolometric luminosity (>10 L ⊙) and significantly higher core masses compared to other sources in this study. The dispersion of outflow rate values for each evolutionary class is approximately a factor of 2.
Other Images in This Article

Show More
Copyright and Terms & Conditions
© 2023. The Author(s). Published by the American Astronomical Society.