Image Details
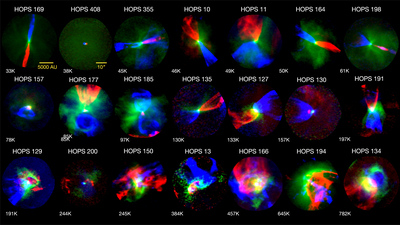
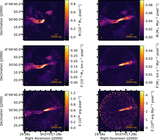
Caption: Figure 2.
Protostellar outflows and envelopes in our survey, which include 21 sources at different evolutionary stages. 12CO J = 2−1 integrated intensity maps trace the blueshifted (blue) and redshifted (red) molecular outflow lobes. C18O J = 2−1 integrated intensity maps, shown in green, trace the dense circumstellar envelope. The upper, middle, and bottom rows show Class 0, Class I, and flat-spectrum protostars, respectively, and are arranged in order of increasing T bol (which we use as a proxy for age) from left to right. Source names are shown above each map. Each map has a diameter of about 50.″4, which is set by the 40% primary beam power response (compared to the center of the map). The coordinates of the center of the panels are given in Table 1.
Other Images in This Article

Show More
Copyright and Terms & Conditions
© 2023. The Author(s). Published by the American Astronomical Society.