Image Details
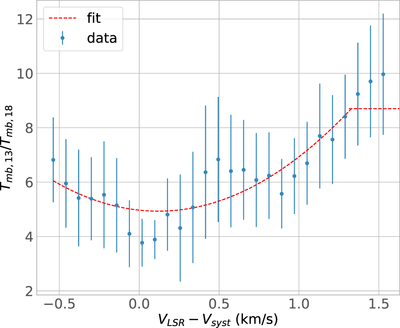
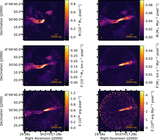
Caption: Figure 4.
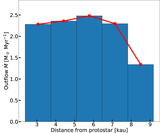
Average 13CO(2–1)/C18O(2–1) brightness temperature ratio in the redshifted outflow lobe of HOPS 169. The ratio is calculated for every velocity channel using data above 3σ within the outflow mask region. The blue points represent the data and the red line denotes the best-fit second-degree polynomial. The polynomial is truncated at the isotopic ratio of 8.7. The error bars represent the dispersion around the mean of the brightness temperature ratio across the redshifted outflow lobe.
Other Images in This Article

Show More
Copyright and Terms & Conditions
© 2023. The Author(s). Published by the American Astronomical Society.
Copyright ©
2025 Astronomy Image Explorer. All Rights Reserved.