Image Details
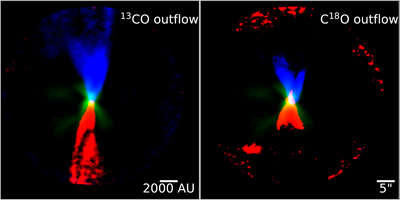
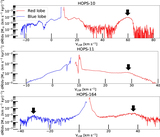
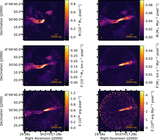
Caption: Figure 3.
HOPS 169 outflow traced by 13CO (left) and C18O (right) centered at α (J2000) = 5h36m36.ˢ1, δ(J2000) = 06°38′54.″2). Left: 13CO J = 2−1 integrated intensity maps are used to trace the blueshifted (blue) and redshifted (red) outflow lobes. Right: same outflow but traced by the C18O J = 2−1 emission. In both plots, the C18O J = 2−1 integrated intensity map (integrated over velocities close to the system velocity) traces the dense envelope, and it is shown in green.
Other Images in This Article
Show More
Copyright and Terms & Conditions
© 2023. The Author(s). Published by the American Astronomical Society.
Copyright ©
2025 Astronomy Image Explorer. All Rights Reserved.