Image Details
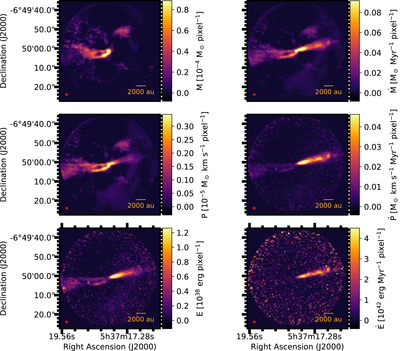
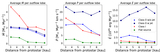
Caption: Figure 10.
HOPS 355 molecular outflow mass, momentum, and energy maps (panels in the left column), and the corresponding rate maps (panels in the right column). The red ellipse in the bottom left of each panel represents the synthesized beam. Note that the pixel size is the same for all maps and is 0.″17 × 0.″17.
Other Images in This Article

Show More
Copyright and Terms & Conditions
© 2023. The Author(s). Published by the American Astronomical Society.
Copyright ©
2025 Astronomy Image Explorer. All Rights Reserved.