Image Details
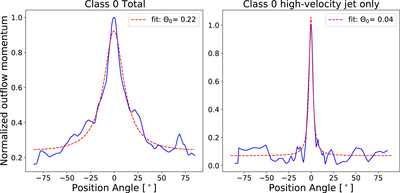
Caption: Figure 16.
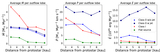
Normalized average outflow momentum angular profile for Class 0 protostars with no sign of outflow precession. The left figure shows the total (average) momentum profile (includes molecular outflow emission at all outflow velocities), and the right figure shows the average momentum profile for the high-velocity jets (HOPS 10 and HOPS 164) identified in Figure 8. The red-dashed line shows the best fit using the theoretical model from Equation (16). All angular profiles have been corrected for the outflows’ inclination.
Other Images in This Article

Show More
Copyright and Terms & Conditions
© 2023. The Author(s). Published by the American Astronomical Society.
Copyright ©
2025 Astronomy Image Explorer. All Rights Reserved.