Image Details
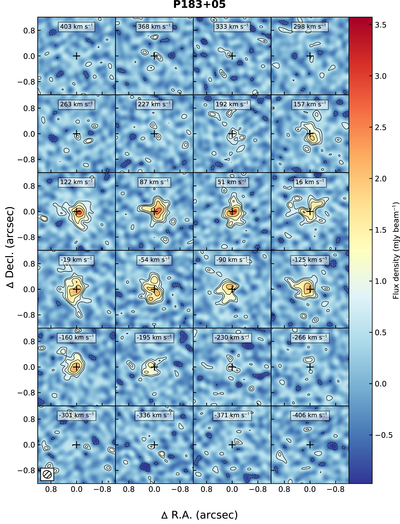
Caption: Figure 9. Channel map of the [C II] emission line
The complete figure set (27 images) is available in the online journal.
Channel maps of the [C II] emission line for P183+05. The image is centered on the optical position of the quasar (black plus sign), and velocities are relative to the redshift of the [C II] emission line as determined in Venemans et al. (2020). Contours start at 2σ and increase in powers of ﹩\sqrt{2}﹩, with negative contours at the same level dashed. The ALMA synthesized beam is shown in the inset in the lower left corner. The channel maps for all quasars of the sample (27 images) are available in the online journal.
Other Images in This Article

Show More
Copyright and Terms & Conditions
© 2021. The American Astronomical Society. All rights reserved.