Image Details
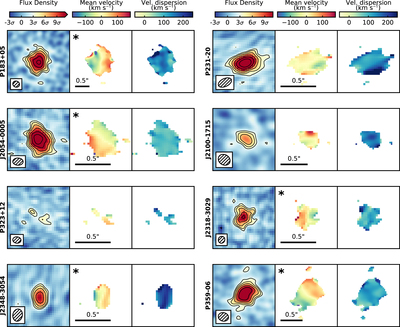
Caption: Figure 1.
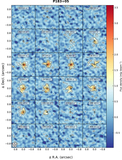
Flux density, mean velocity, and velocity dispersion maps of the 18 quasar host galaxies belonging to the “undisturbed” quasar host sample. The left panel shows the flux density of the [C II] emission line for a channel centered on the [C II] emission with a channel width of 1.2× the FWHM (see Venemans et al. 2020). The ALMA synthesized beam is shown in the inset in the lower left corner, and contours are drawn at 3σ and increase in powers of ﹩\sqrt{2}﹩, with negative contours dashed. The middle panel shows the mean velocity field, where we define the zero velocity to be at the systemic redshift of the [C II] emission, which was determined from the integrated [C II] spectrum (Venemans et al. 2020). The black scale bar shows an angle of 0.″5, which corresponds to a physical distance of about 2.7 kpc at the redshift of the quasar. Quasar host galaxies that show a smooth velocity gradient are marked with an asterisk. The right panel displays the velocity dispersion of [C II] emission. For the latter two columns we only show pixels that have been detected at 3σ in the [C II] flux density map. In all panels north is up and east is to the left.
Other Images in This Article

Show More
Copyright and Terms & Conditions
© 2021. The American Astronomical Society. All rights reserved.