Image Details
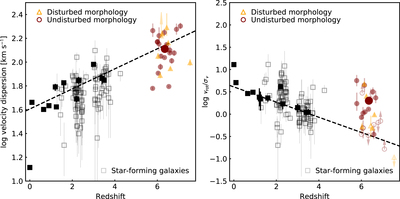
Caption: Figure 5.
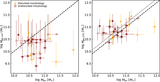
Left: redshift evolution of the velocity dispersion. The z ≳ 6 quasar host galaxy sample is shown with colored symbols and is divided into two subsamples based on the [C II] morphology. The large filled circle is the average velocity dispersion for the undisturbed [C II] subsample. The squares are low-redshift measurements for massive, near-main-sequence galaxies for both full sample averages (filled black squares) and individual measurements (open gray squares). An exponential extrapolation based on the low-redshift data is shown by the dashed line, indicating that the z ≳ 6 quasar sample falls on this simple extrapolation. Right: redshift evolution for the ratio between rotation velocity and velocity dispersion, vrot/σv. Here the open symbols in the z ∼ 6 quasar sample mark upper and lower limits. The z ≳ 6 quasar host galaxies have vrot/σv comparable to z ∼ 2–3 galaxies, which is higher than a simple extrapolation based on the lower-redshift data (dashed line).
Other Images in This Article

Show More
Copyright and Terms & Conditions
© 2021. The American Astronomical Society. All rights reserved.