Image Details
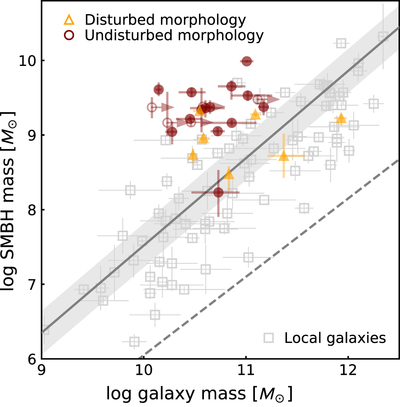
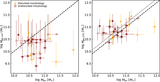
Caption: Figure 7.
Black hole mass vs. the dynamical mass estimate for the z ≳ 6 quasar sample. Also shown is the black hole mass vs. bulge mass for local galaxies (Kormendy & Ho 2013; de Nicola et al. 2019) on the same axes. The fit to this data from Kormendy & Ho (2013) is shown as a solid line, where the shaded region marks the 1σ scatter seen in the data around this correlation. Also shown is the fit to the total stellar mass vs. black hole mass for local AGNs (dashed line; Reines & Volonteri 2015). The quasar sample is apportioned into two groups based on the [C II] morphology, which are generally observed above the locally derived correlation.
Other Images in This Article

Show More
Copyright and Terms & Conditions
© 2021. The American Astronomical Society. All rights reserved.