Image Details
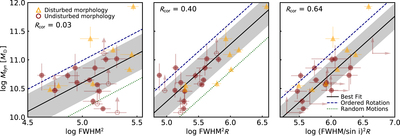
Caption: Figure 6.
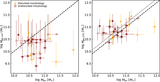
Dynamical mass estimates determined from modeling the [C II] emission line plotted against several observables available in low-resolution observations. In the left panel, we plot the dynamical mass against the square of the FWHM of the [C II] emission line (FWHM2). There is no strong correlation found between these two quantities with a correlation coefficient, Rcor, of 0.03. A best-fit line is shown by the solid black line, where the uncertainties on the line (gray shaded region) encompass >68% of the data. Also shown are the dynamical mass estimates assuming that the mass is dispersion dominated (dotted line; Equation (11)) and rotationally supported (dashed line; Equation (12)), which bracket the dynamical mass estimates. The middle panel shows the dynamical mass against the observable, FWHM2 R, where R is the radial extent of the emission. There is a better correlation between these quantities, resulting in a better estimate of the dynamical mass. Finally, the best estimate for the dynamical mass can be obtained from the observable (FWHM/sin i)2R (right panel). Equations (14)–(16) give the conversions from these observables to the dynamical mass.
Other Images in This Article

Show More
Copyright and Terms & Conditions
© 2021. The American Astronomical Society. All rights reserved.