Image Details
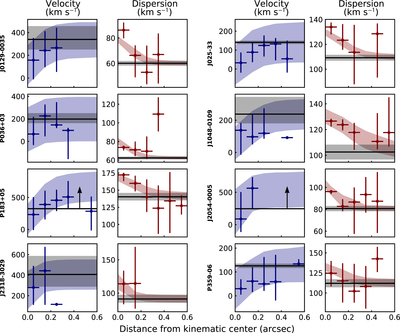
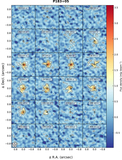
Caption: Figure 3.
Velocity and dispersion profiles of the eight galaxies that have emission extended over greater than two beams along the major axis, show a clear velocity gradient, and show no evidence of merger activity or nearby companion. The left panel displays the velocity profile for the data with 1σ uncertainties. The blue shaded region marks the 16th to 84th percentile range of the rotational velocity profile as determined from the constant-velocity model convolved with the beam. The black (and gray) shading is the constant rotational velocity (and 1σ uncertainties) as determined from the kinematic modeling. The right panel is similar to the left, except for the velocity dispersion measurements. In all galaxies the agreement between the model and data for both the rotational velocity and velocity dispersion suggests that the assumed constant rotational velocity and velocity dispersion are sufficient at this resolution.
Other Images in This Article

Show More
Copyright and Terms & Conditions
© 2021. The American Astronomical Society. All rights reserved.