Image Details
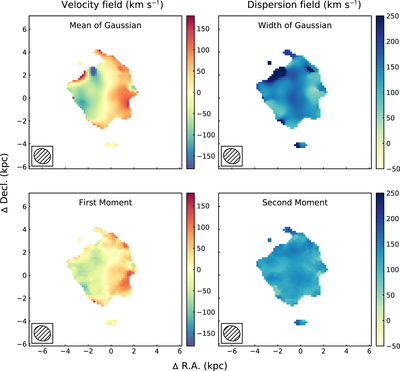
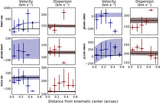
Caption: Figure 14.
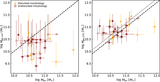
Comparison between the two different methods for generating velocity and dispersion fields for the [C II] emission line from the host galaxy of quasar P183+05. The top row shows the results from fitting a single Gaussian function to the spectrum of each individual spaxel. The data are masked to show only pixels that have been detected at >3σ in the total intensity field. The bottom row is the first moment of the data cube, where the data have been clipped at >1σ. Both methods yield roughly the same velocity and velocity dispersion field. Since the Gaussian fitting routine is independent of the S/N of the data, we opt to use this method in our analysis. The ALMA synthesized beam for these observations is shown in the inset in the lower left corner.
Other Images in This Article

Show More
Copyright and Terms & Conditions
© 2021. The American Astronomical Society. All rights reserved.