Image Details
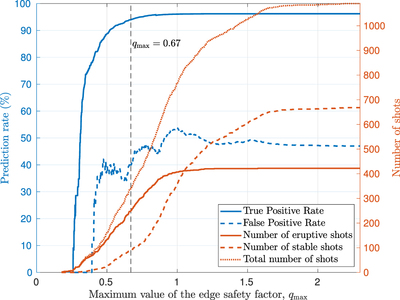
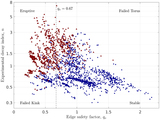
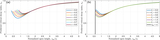
Caption: Figure 7.
Statistical validity of our ﹩{n}_{\mathrm{cr}}^{}﹩ prediction as a function of the maximum value of the edge safety factor that is to be considered, ﹩{q}_{\max }﹩. The TPR and FPR are both plotted as functions of ﹩{q}_{\max }﹩. The number of shots that are considered for each threshold is also plotted both as a fraction of the total and an absolute number. The value of ﹩{q}_{\max }=0.67﹩ that has been used in the previous analysis has been chosen to maximize the TPR with minimal gain in FPR. It coincides with TPR = 94% and FPR = 40%.
Other Images in This Article
Copyright and Terms & Conditions
© 2021. The American Astronomical Society. All rights reserved.
Copyright ©
2026 Astronomy Image Explorer. All Rights Reserved.