Image Details
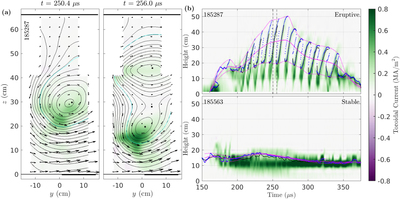
Caption: Figure 5.
(a) Example cuts of the toroidal current density (in color) at the apex of an eruptive flux rope, with arrows representing the in-plane magnetic field and dots at the nulls of this field. Contours of constant flux are shown with black curves, and the flux contour that contains 80% of the total current is marked in cyan. The first panel is a time when the rope is rising and only a single apex value exists. The second panel is a later time, after a lower rope has formed that will soon erupt while the remaining portion of the initial rope can still be seen. This example event is counted as an eruption. (b) An example of the time evolution of the apex height in an eruptive rope (top) compared with a stable one (bottom). The locations of the apex height are plotted with blue dots, and a filtered height and envelope are plotted in magenta. The peak value of the toroidal current density at each height is also plotted in color. The times shown in panel (a) are marked with dashed lines in the top panel. Near the end of each eruption in the eruptive example, the apex height becomes multivalued as a new rope is formed at a lower height.
Other Images in This Article
Copyright and Terms & Conditions
© 2021. The American Astronomical Society. All rights reserved.