Image Details
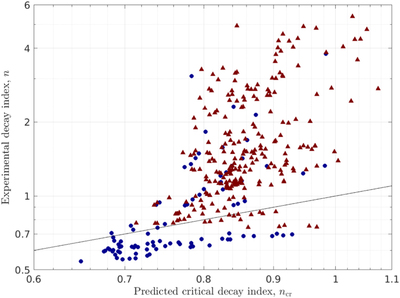
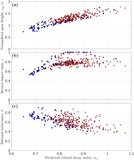
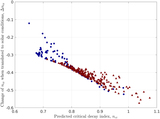
Caption: Figure 6.
Measured experimental decay index, n, vs. numerically calculated predicted critical decay index, ﹩{n}_{\mathrm{cr}}^{}﹩, presented on a log–log plot. The represented shots are limited in edge safety factor, qa < 0.67. Eruptive shots are represented with red triangles, while noneruptive shots are blue circles. The experimental parameters, zap/xf, ε ≡ a/R, and ℓi, of each shot are fit to our numerical model to determine a value of ﹩{n}_{\mathrm{cr}}^{}﹩. The line ﹩n={n}_{\mathrm{cr}}^{}﹩ is also plotted. The model predicts that all shots above this line should be unstable, while the ones below it are stable.
Other Images in This Article
Copyright and Terms & Conditions
© 2021. The American Astronomical Society. All rights reserved.