Image Details
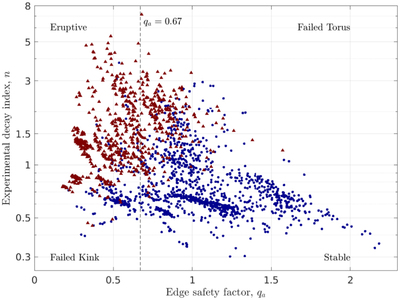
Caption: Figure 4.
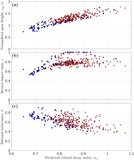
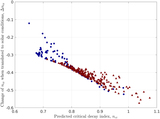
Experimental parameter space. Each point represents a shot and is placed based on its value of the two ideal MHD instability parameters, qa and n. Shots that experienced multiple eruptions are represented with red triangles, while noneruptive shots are blue circles. Four different regions of stability can be seen, though their boundaries are not perfectly defined by the parameters. The dashed line at qa = 0.67 is an empirical cutoff used to isolate the torus instability transition from the failed torus regime. For later analysis, we will only consider the shots to the left of this line.
Other Images in This Article
Copyright and Terms & Conditions
© 2021. The American Astronomical Society. All rights reserved.
Copyright ©
2026 Astronomy Image Explorer. All Rights Reserved.