Image Details
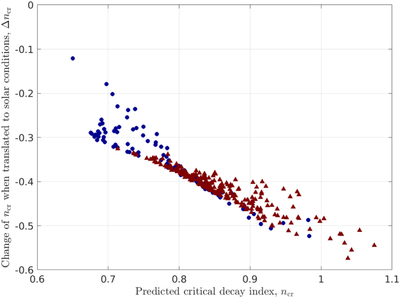
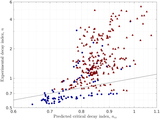
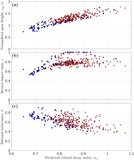
Caption: Figure 10.
Change in the predicted ﹩{n}_{\mathrm{cr}}^{}﹩ when the laboratory conditions are translated to the Sun but with nI = 0. Each shot in Figure 6 is represented, with eruptive shots again being represented by red triangles and noneruptive shots by blue circles. The changes due to current closure and eddy currents in the outer vessel wall are both accounted for and create a change centered on ﹩{\rm{\Delta }}{n}_{\mathrm{cr}}^{}\sim -0.4﹩ in a larger range of ﹩{\rm{\Delta }}{n}_{\mathrm{cr}}^{}\sim (-0.5,-0.3)﹩.
Other Images in This Article
Copyright and Terms & Conditions
© 2021. The American Astronomical Society. All rights reserved.
Copyright ©
2026 Astronomy Image Explorer. All Rights Reserved.