Image Details
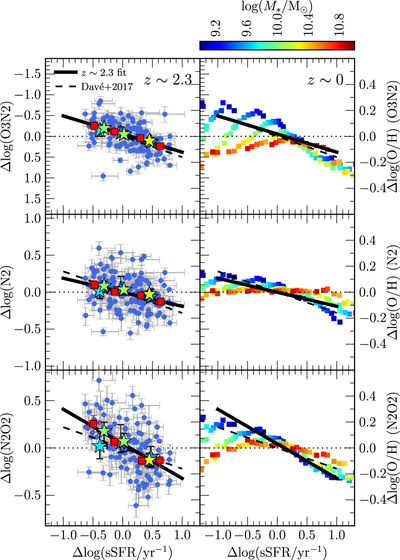
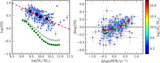
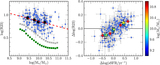
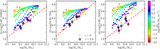
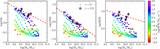
Caption: Figure 3.
Deviation plots comparing the residuals around mean line ratio and metallicity versus ﹩{M}_{* }﹩ relations (Δlog(line ratio) and Δlog(O/H)) to residuals around the mean ﹩{M}_{* }﹩–sSFR relation (Δlog(sSFR/yr−1)). The top, middle, and bottom rows display residuals for line ratio and metallicities based upon O3N2, N2, and N2O2, respectively. In each panel, the left vertical axis shows the scale of the residuals in each line ratio, while the right vertical axis displays the scale of the corresponding residuals in metallicity. The z ∼ 2.3 sample is shown in the left column, while the right column presents residuals for the z ∼ 0 ﹩{M}_{* }﹩–SFR stacks of Andrews & Martini (2013), color-coded by ﹩{M}_{* }﹩. In the left column, blue circles denote individual z ∼ 2.3 galaxies, red squares show medians in bins of Δlog(sSFR/yr−1), and colored stars display the z ∼ 2.3 ﹩{M}_{* }﹩–ΔsSFR stacks, color-coded by ﹩{M}_{* }﹩. The solid black line shows the best fit to the z ∼ 2.3 medians, with best-fit slope given in Table 3. The prediction from the cosmological simulations of Davé et al. (2017) is presented as the black long-dashed line.
Other Images in This Article
Copyright and Terms & Conditions
© 2018. The American Astronomical Society. All rights reserved.