Image Details
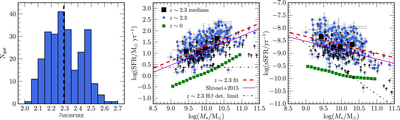
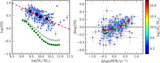
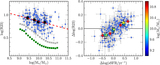
Caption: Figure 1.
Sample properties of the z ∼ 2.3 star-forming galaxy sample from the MOSDEF survey. LEFT: redshift distribution of the z ∼ 2.3 sample with Hα and Hβ detections, where the dashed vertical line displays the median redshift of zmed = 2.29. MIDDLE: the SFR–﹩{M}_{* }﹩ relation for the z ∼ 2.3 sample. Galaxies at z ∼ 2.3 with detections of both Hα and Hβ are shown as blue circles with error bars. Black squares display the median ﹩{M}_{* }﹩ and SFR of z ∼ 2.3 galaxies with Hα and Hβ detections in four bins of ﹩{M}_{* }﹩ over the range ﹩9.0\lt \mathrm{log}({M}_{* }/{M}_{\odot })\lt 10.5﹩. The best-fit linear relation to the ﹩{M}_{* }﹩ bins is displayed as a red dashed line, with best-fit coefficients given in Table 2. The purple line is the SFR–﹩{M}_{* }﹩ relation at 1.4 < z < 2.6 from Shivaei et al. (2015). Black arrows show 3σ lower limits on SFR and sSFR for galaxies with detected Hα but Hβ non-detections. The 3σ Hβ detection threshold at z ∼ 2.3 for MOSDEF observations is indicated by the dotted–dashed line, scaled from the 5σ value in Kriek et al. (2015). Green squares denote the ﹩{M}_{* }﹩-binned stacks of z ∼ 0 SDSS star-forming galaxies from Andrews and Martini (2013). RIGHT: the ﹩{M}_{* }﹩–sSFR relation for the z ∼ 2.3 sample, with symbols and lines the same as in the middle panel.
Other Images in This Article
Copyright and Terms & Conditions
© 2018. The American Astronomical Society. All rights reserved.