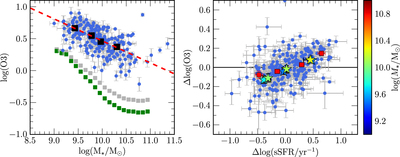
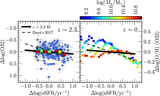
LEFT: the line ratio O3 as a function of ﹩{M}_{* }﹩ for the z ∼ 2.3 and z ∼ 0 samples, with points and lines the same as in Figure 2. RIGHT: the deviation plot of Δlog(O3) versus Δlog(sSFR/yr−1) for z ∼ 2.3 galaxies, with points the same as in the middle column of Figure 3.