Image Details
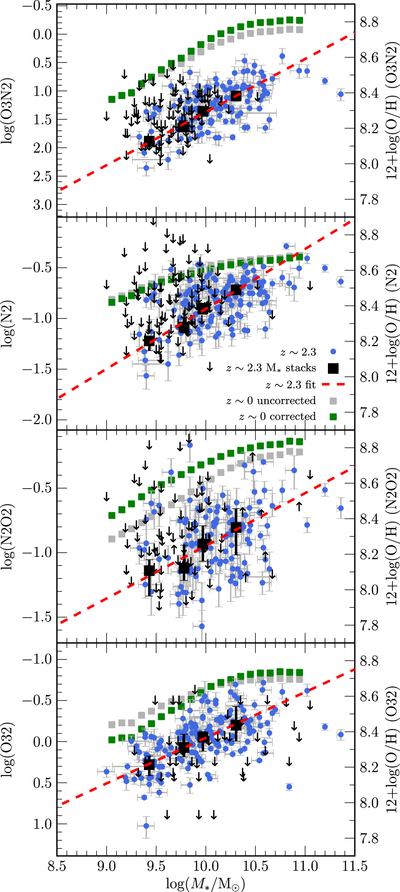
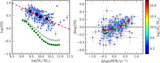
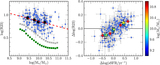
Caption: Figure 2.
Emission-line ratios O3N2, N2, N2O2, and O32 versus ﹩{M}_{* }﹩ for the z ∼ 2.3 and z ∼ 0 comparison samples. The left y-axis displays the emission-line ratio values, while the right y-axis displays the translation into metallicity according to Equations (7), (8), (11), and (10). All y-axes are oriented such that metallicity increases upwards, and span the same range in metallicity. The z ∼ 2.3 galaxies with SFR measurements are shown as blue circles when all of the required emission lines are detected for each line ratio, while black arrows display 3σ limits when one or more of the required lines is not detected. Stacks of both detections and non-detections in bins of ﹩{M}_{* }﹩ are indicated by black squares. The red dashed line is the best-fit linear relation to the stacks in each panel, with the best-fit parameters given in Table 2. Gray squares show the z ∼ 0 ﹩{M}_{* }﹩ stacks of Andrews & Martini (2013) prior to correction for DIG contamination, while green squares show the same stacks after correcting for contamination from DIG using the models of Sanders et al. (2017).
Other Images in This Article
Copyright and Terms & Conditions
© 2018. The American Astronomical Society. All rights reserved.